Work
filter your experience
Services
Observation Deck: Sharing Successful Library Outcomes
An IMLS funded project in collaboration between Madison Public Library, Skokie Public Library, and Waupaca Public Library sought to address the challenge of capturing and sharing qualitative data from hands-on library programs. By developing an open-source, digital toolkit, the project empowers libraries to document their impact, enhance their offerings, and engage stakeholders in meaningful ways.
Madison Public Library (MPL), in collaboration with Skokie Public Library (SPL) and Waupaca Public Library (WPL), sought out to develop a librarians toolkit under a IMLS funded project. Their goal was to develop a digital toolkit that would collect and analyze qualitative data in hands-on experiential library programs to support outcomes sharing to stakeholders and continuous cycles of improvement.

The Demand for Observation Deck
Public Libraries are doing valuable work for their communities and the only way to showcase their impact has been through attendance and collection data. But, with more libraries nationwide shifting towards hands-on experiential learning such as in arts, maker or STEAM programs where outcomes are more qualitative, capturing and sharing the impact has been more difficult.
Observation Deck aims to fill this gap by building a digital toolkit that would allow librarians to capture stories to round out the library’s impact beyond traditional data metrics in a systematic and organized manner.
Understanding the Research & Project Goals
Byte joined the project as the developer through a three-year IMLS grant. MPL approached us after conducting comprehensive research in existing practices and tools within the observational assessment and informal learning. They also conducted a nationwide library survey to identify technological barriers and determine meaningful outcomes librarians want to capture and share.
This research informed the decision to make the toolkit open source and web based as well as the creation of institution-specific observational frameworks.
It also defined the core functions of the toolkit:
- Data Collection: Support multimedia capturing, tagging data based on predetermined observational framework tags, and use without interrupting workflow.
- Data Analysis: Give insight to support continuous improvement cycles by identifying improvement opportunities and aid in successful outcomes sharing with stakeholders and library teams for future decision-making.
- Sustainable and Expandable Model: Support dissemination to a large number of national partners and internal teams
With a deep grasp of the research, we conducted fieldwork by participating in diverse library programs across the three partner libraries. This experience helped us understand how the toolkit would be used across libraries of different sizes and objectives.
Defining Tech & Data Infrastructure
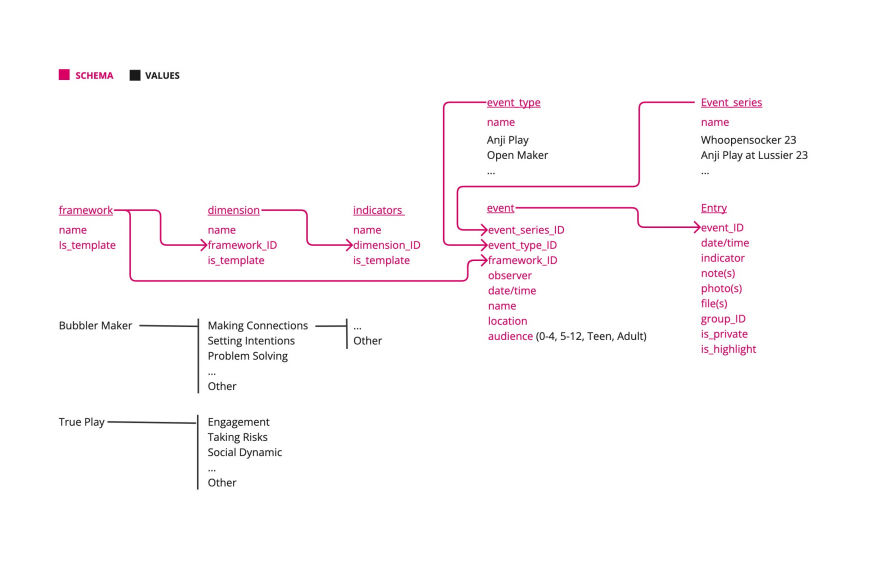
Defining Data Schema
First, we created an early data schema to begin defining the data points.
Defining Our Technology Stack
Any time we begin a green field development project, we don’t want to jump into the latest or coolest technology, instead we want to decide what’s right for the project. And because we have a unique audience–technologists–we thought about developer experience.
We created a list of DOs and DONTs to help us find the perfect tools to build with, and the perfect software to pair with:
- Directus as data and auth provider (open source, great data, REST / GraphQL)
- Vue+Quasar as framework (does router and store, but not 1000 other things)
- Quasar has a UMD version that skips the need for build step

Ideating to define function and features
Designing the Data Collection Tool
We first started by defining the mobile-first data collection tool using prototypes.
We knew that we needed a workflow that would allow us to test early and fast so we sought out tools that would allow us to prototype with real data simulation and easily share versions with our client for feedback.
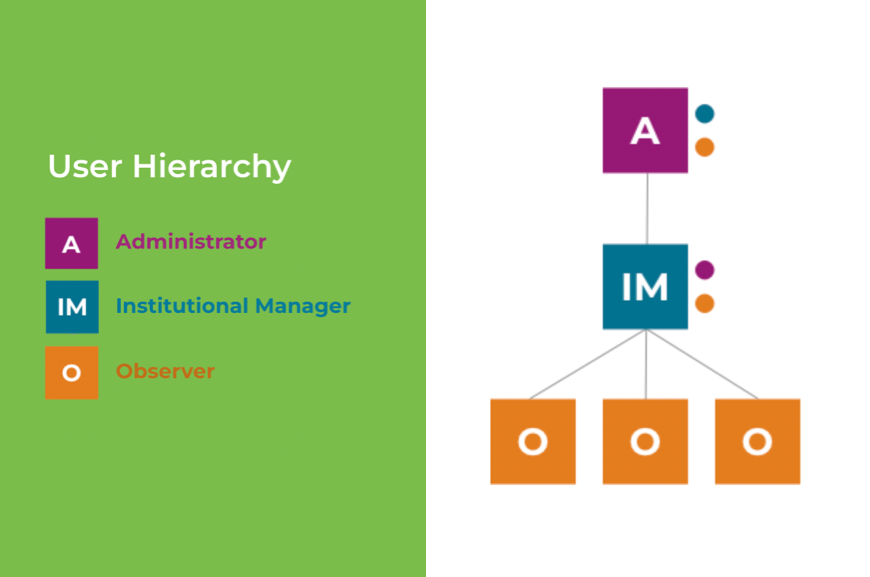
Our first round of prototyping focused on incorporating all the specified features. Additionally, it aided in defining the different user types, their hierarchical relationship and their respective capabilities.
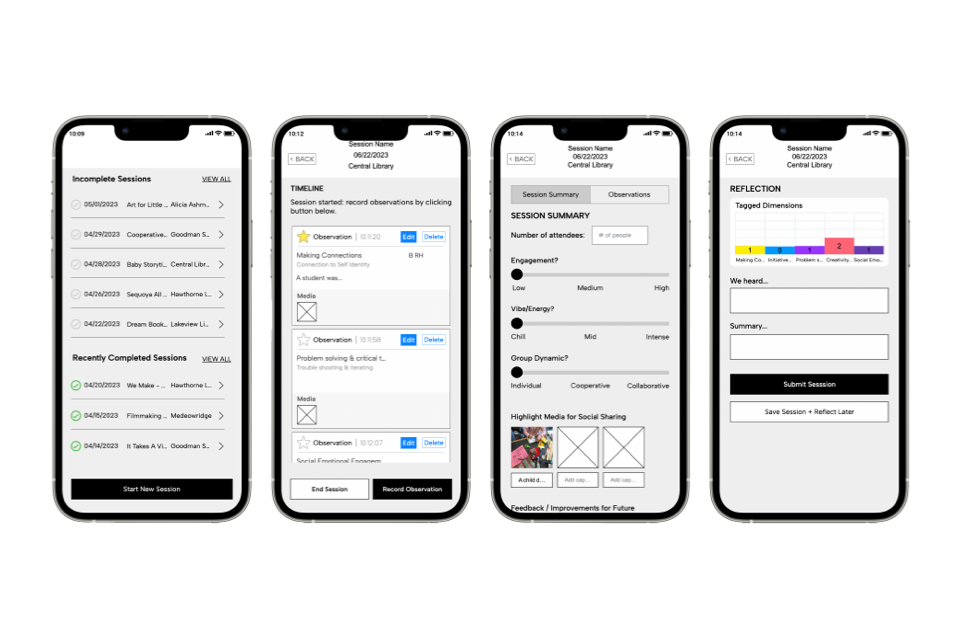
Our second round of prototyping focused on improving the user journey from beginning to end by clearly defining each stage: login/sign up, home screen / dashboard, details, timeline, session summary, and session reflection.
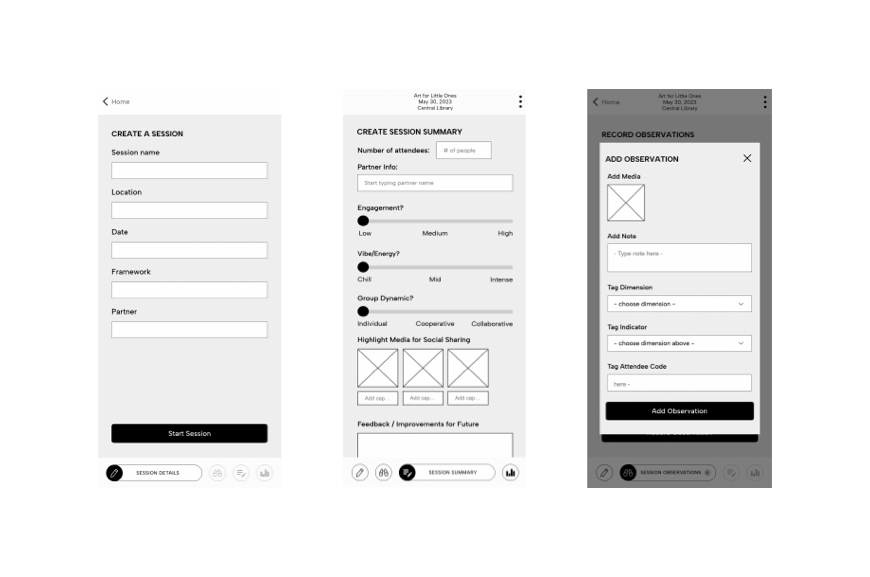
Our third round of prototyping focused on upgrading the UI system to improve the user experience.
 Then, we built a beta version of the data collection tool which was used by the three partner libraries for real-life capturing. This data would become the sample data for testing our analysis tool later on.
Designing the Analysis Tool
Next, we embarked on designing the data analysis tool. We consulted our clients to understand their preferences for exploring data and the types of reporting and sharing that would be beneficial to them.
Initially, we categorized the types of analysis into four main type:
- Series / partner-specific data analysis
- Social media / newsletter reporting
- Feedback report
- Quarterly / semester analysis
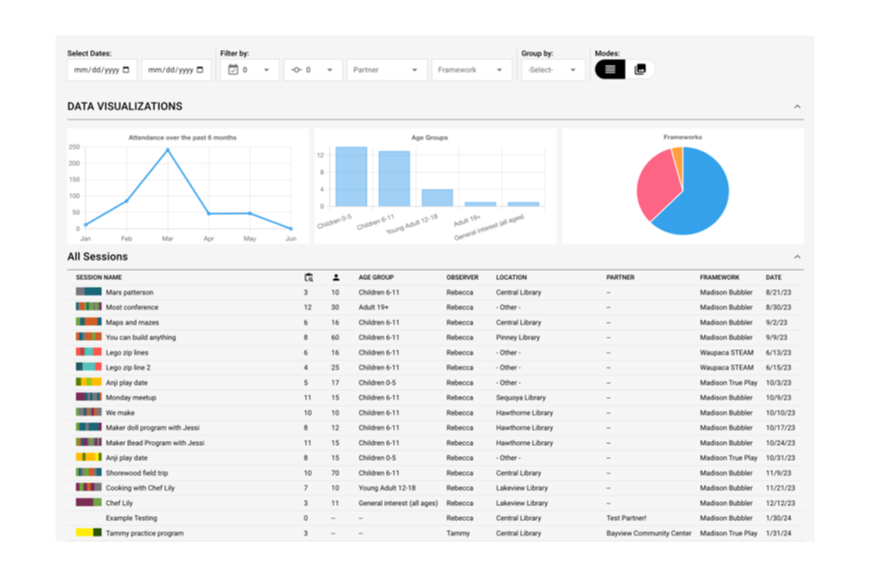
This process resulted in the development of a systematic analysis tool equipped with robust filtering, grouping and modes options to facilitate comprehensive data exploration. After wrapping up the design of the toolkit, we started our branding phase.
Branding
Exploring Creative Directions
Because assessment is a central component of toolkit, we knew that we had to develop a brand identity that countered the prevalent weariness surrounding assessment tools in learning environments. The brand needed a look and feel that was approachable, vibrant and inviting.
The journey began with the naming process. The chosen name needed to draw a connection to the core function of the toolkit. To do so, a naming framework was devised to explore various options. After extensive brainstorming and iteration, “Observation Deck” was selected.
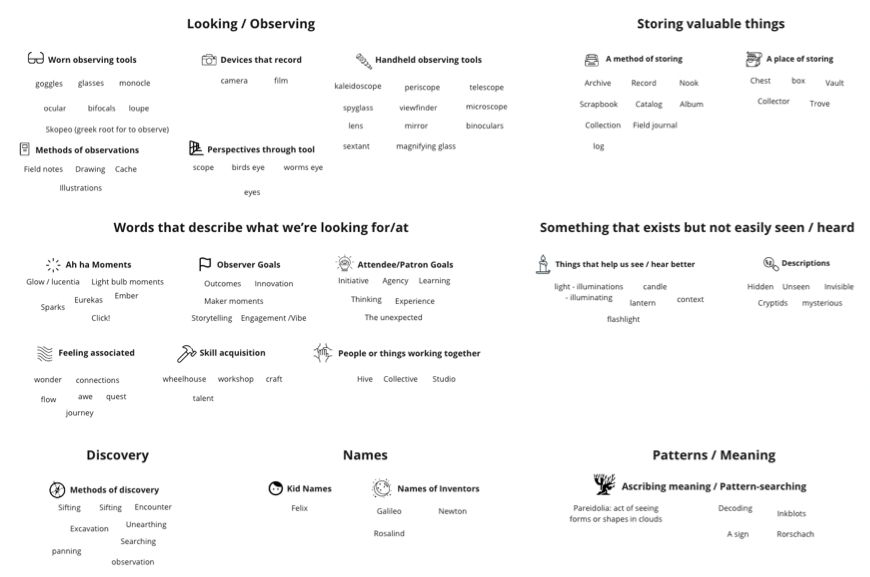
To begin defining the visual look and feel, we turned to creating competing thematic concepts coupled with mood boards.
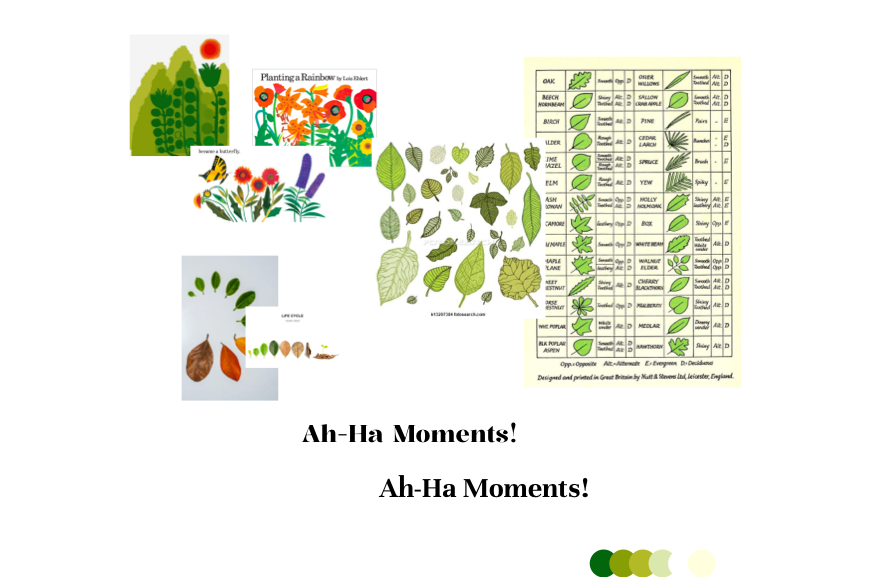
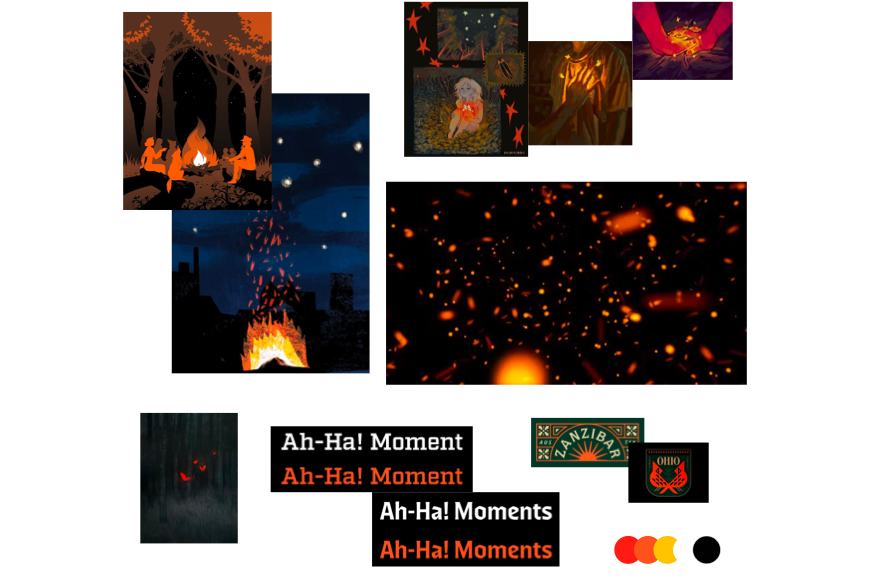
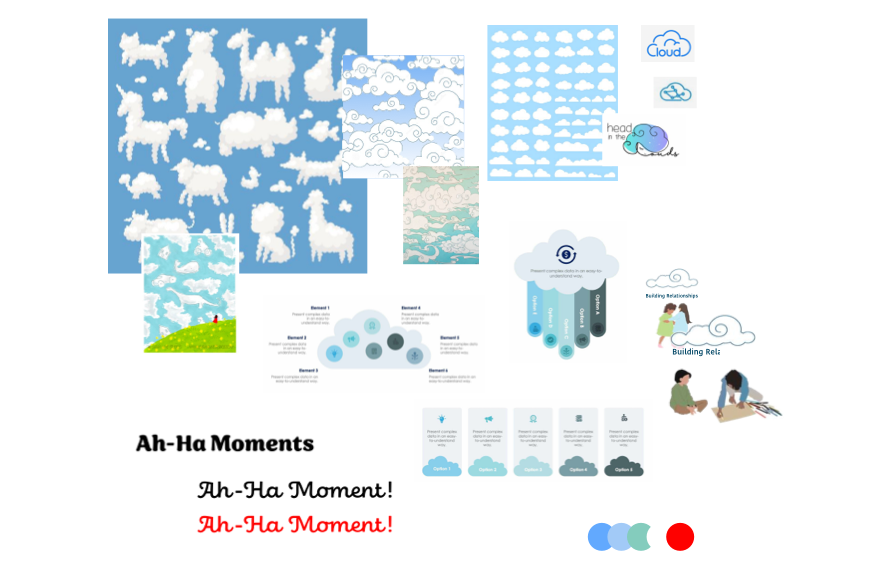
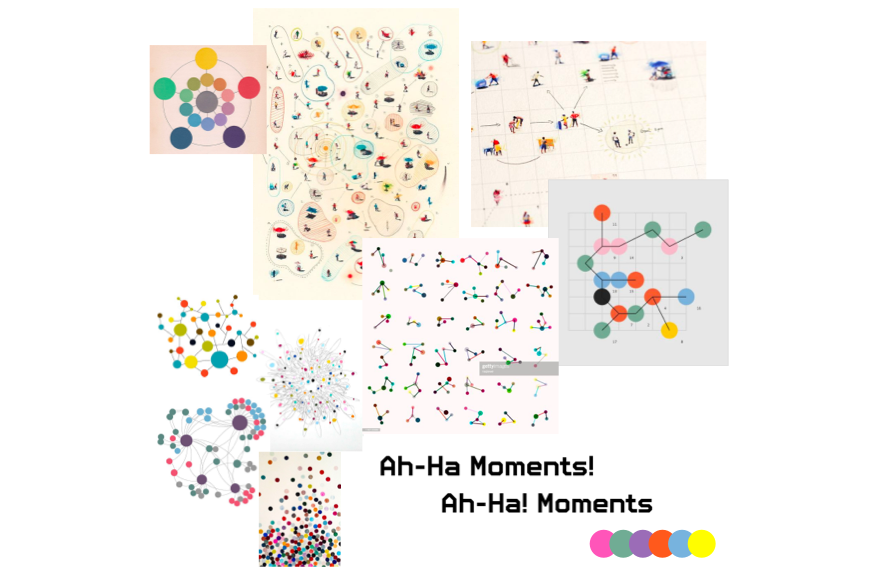
An idea inspired by the color wheel emerged as the preferred choice due to its modern aesthetic, its connection to components of the toolkit such as systemization and sorting.
Designing the Logo
After many sketches and cycles of refinement, we created a logo that spoke to the key function of the toolkit.
Similar to a color wheel, Observation Deck functions as a sophisticated system for storing and categorizing data. An important feature of the toolkit is its data tagging capability subtly shown in the word mark through the use of colored dots. Additionally, an exclamation point is introduced to create energetic and welcoming feel.
Designing the Product Website
Observation Deck is a new type of tool — built on new ideas and methodologies in the field of observational practices. Therefore, a storytelling approach was utilized to communicate the power of the tool on its product website.
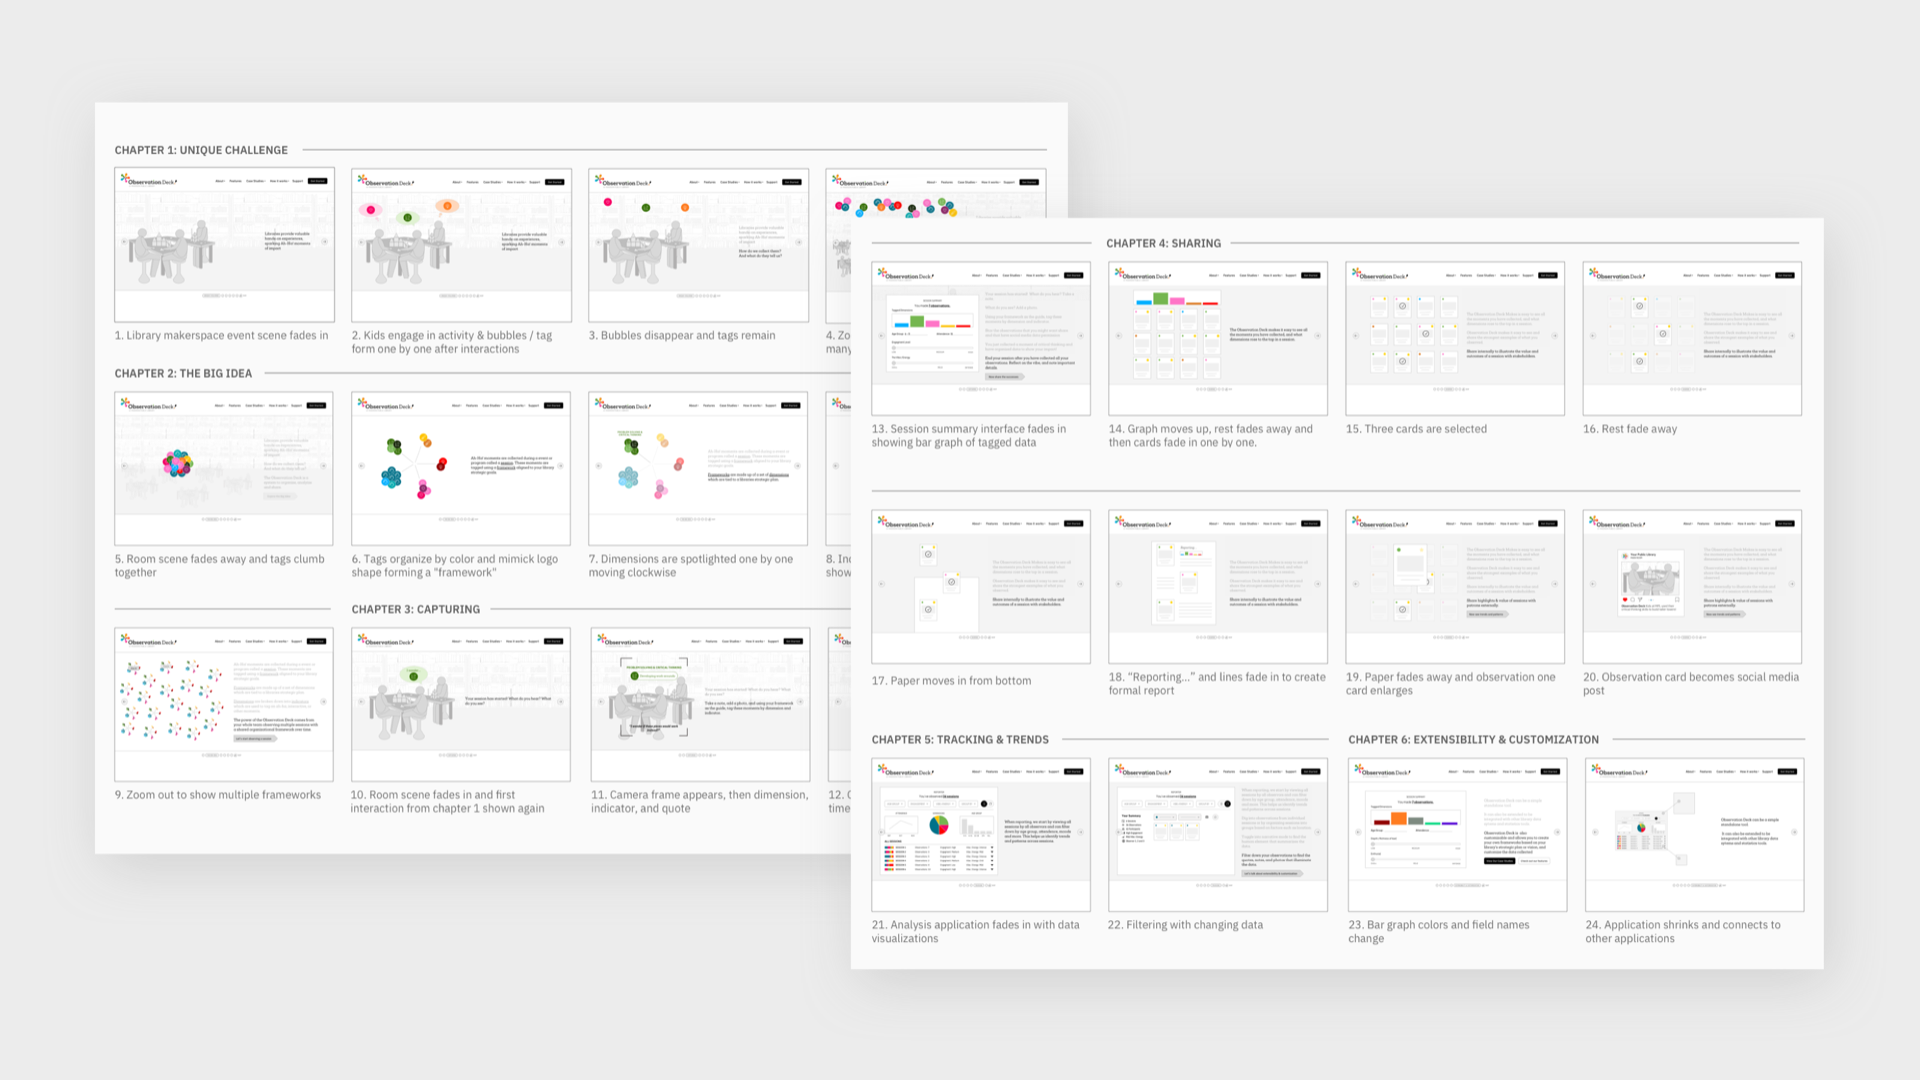
When people first land on the website, they are greeted by a captivating multi-slider animated illustration that introduces visitors to the capabilities of the Observation Deck toolkit.
The website also includes scrolling animations illustrating the core functions of the tool: collection, organization, analysis.
On going Results & Successes
The development and launch of Observation Deck marked significant milestones in our mission to enhance the efficiency and effectiveness of public libraries across the nation. The official public launch at the ALA 2023 conference in Chicago and the PLA 2024 conference in Columbus have been pivotal moments, garnering attention and interest from library administrators nationwide. These events provided invaluable opportunities for dialogue and feedback, underscoring the potential of Observation Deck to revolutionize library operations.
Our ongoing conversations with library administrators reflect a strong interest in adopting Observation Deck, indicating its relevance and utility in addressing the unique challenges faced by public libraries. These discussions have been instrumental in shaping our approach to creating a sustainable and scalable model. By focusing on affordability and ease of implementation, we aim to ensure that libraries of all sizes can benefit from our toolkit.
As we move forward, our primary goal is to establish a sustainable model that allows for widespread adoption of Observation Deck. We are committed to making the toolkit accessible through an affordable monthly subscription, thereby enabling libraries nationwide to leverage its capabilities. The positive reception and interest we have received thus far affirm our belief in the transformative potential of Observation Deck.
I cannot imagine a better partner to journey into the great unknown of software development with than Byte studios. When the grant team from Madison Public Library began the Observation Deck, our experience with creating digital tools was minimal to zero. We had a dream, we had a ton of research, and we thought we knew... sort of?...what we wanted. And then we sat down with Byte. Immediately, we knew we were in the right hands. They were ready to dream with us, but also to systematically and strategically plan our journey so we could arrive at something incredibly special, unique, and game changing for the practicing librarian.
Madison Public Library's Observation Deck